- Home
- New simulation
- Description
- Precomputed star counts
- References
- Additional services
- Disclaimer
- Changes log
last modification:
Thu Dec, 11 2025 11:24 UTC
Star counts
We have computed star counts in a number of directions, for those who just need an estimation of the number of stars at a given magnitude.
These tables are computed in step of 1 magnitude and in the Johnson V and 2MASS K bands.
V band counts:
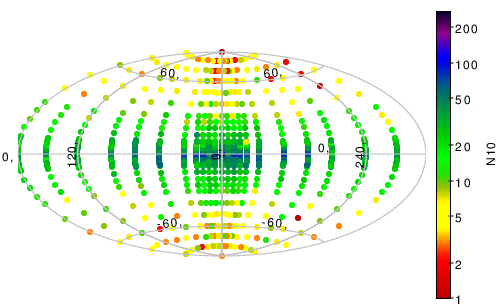
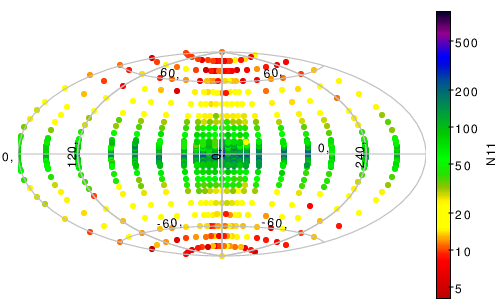
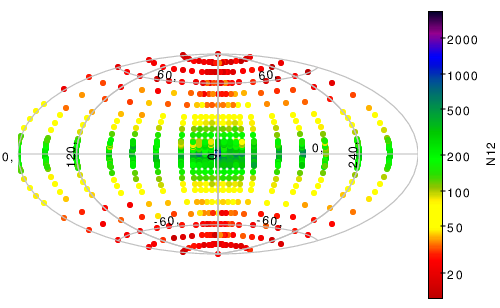
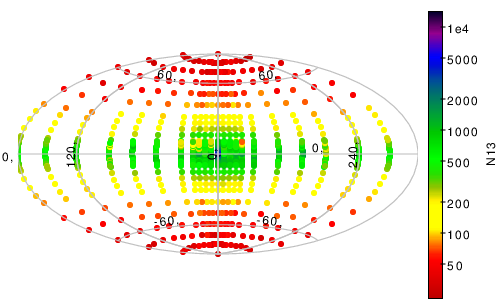
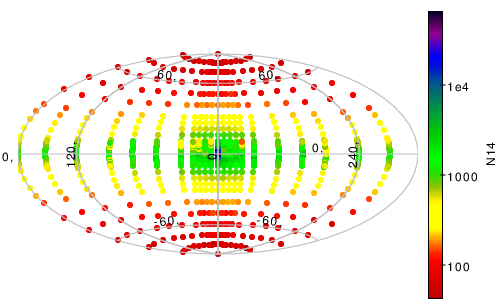
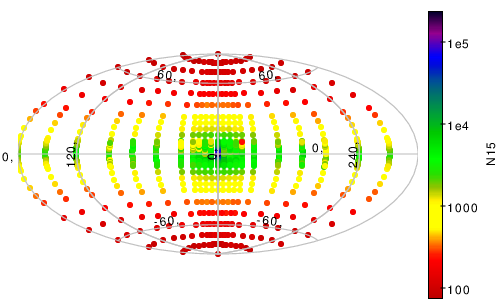
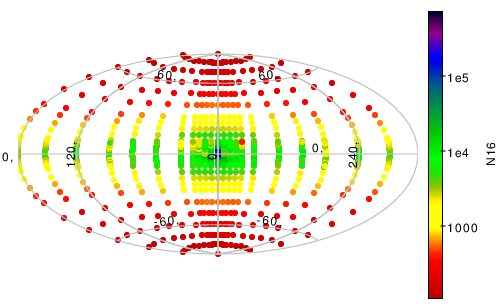
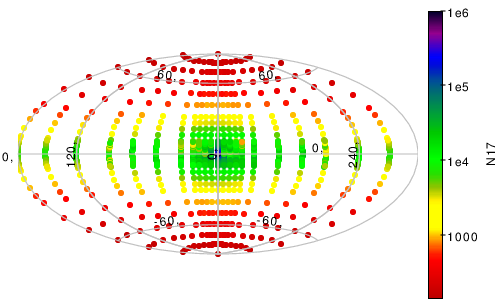
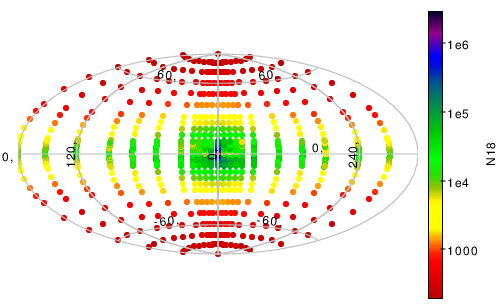
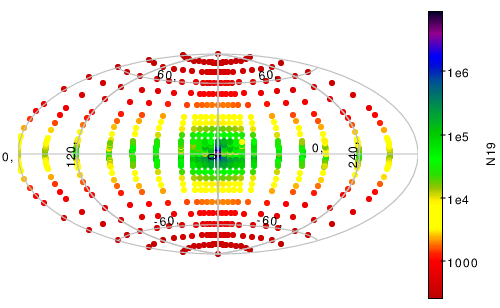
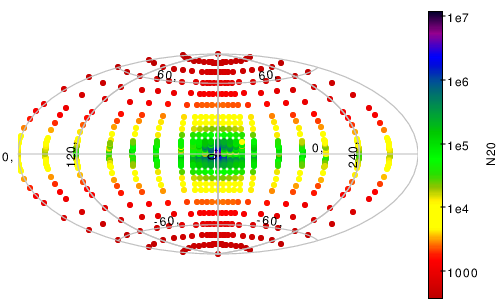
Table 1 gives the differential star counts per square degree
in different directions for magnitude bins between 3 and 21.
The indicated number at the top of each column is the inferior magnitude of the bin.
Hence column N7 gives counts in magnitude bin 7<V<8.
Table 2 gives the cumulative star counts per square degree
in different directions,
that is up to a given magnitude between 3 and 21.
The indicated number at the top of each column is the maximum magnitude to which the stars have been counted.
Hence column N7 gives counts with V<7.
K band counts:
TableK1 gives the differential star counts per square degree in different directions
for magnitude bins between 3 and 21. The indicated number at the top of each column
is the inferior magnitude of the bin.
Hence column N7 gives counts in magnitude bin 7<K<8.
TableK2 gives the cumulative star counts per square degree in different directions,
that is up to a given magnitude between 3 and 21. The indicated number at the top of each column
is the maximum magnitude to which the stars have been counted.
Hence column N7 gives counts with K<7.
Gaia G band counts:
Tables for star counts estimated for the Gaia mission, in the G band, are given in a healpix grid,
in a table with star counts in 1 magnitude bin, for a sky area of 8.59 square degree in each healpix bin.
These star counts have been done with a slightly different model (named GOG18), done specifically for Gaia,
which includes photometric errors for the end of mission. The model follows mainly the thin disc modelling
explained in Czekaj et al (2014)
[ADS],
and the same thick disc, bulge and halo, as in model msp1612 presented above.
(see table).
For the Gaia mission, we have computed specific star counts in the G band,
using a slightly different model, described in Robin et al (2012)
[ADS]
and using the DPAC computing tool GOG (Gaia Object Generator,
http://cdsads.u-strasbg.fr/abs/2014A%26A...566A.119L).
These star counts are summarized here (link) in healpix sky regions of 8.59 square degree each.
They include photometric errors for the end of mission.
The Galaxy model follows mainly the thin disc modelling explained in Czekaj et al (2014)
[ADS],
and the same thick disc, bulge and halo, as in model msp1612 presented above.


